Debugging CWL Workflows and Tools in Arvados
Arvados 2.2 introduced a new feature that can help to debug your workflows: interactive ssh connectivity to running containers. This presents a good opportunity to provide an overview of debugging patterns and tools for running CWL workflows in Arvados.
This article will describe techniques to help determine why an Arvados workflow isn’t running or is returning unexpected results. This will be done with examples of “broken” code and the use of these techniques to debug them. All the files used are available here for download on Github and can be run on the Arvados playground.
This article assumes knowledge about the basic technical components of Arvados. A video with a technical overview of Arvados is available on Youtube.
Debugging techniques
CWL workflow validation
One of the first steps before running a CWL workflow or tool on Arvados is to validate the CWL code.
arvados-cwl-runner has a --validate command line option which validates CWL document without submitting it to Arvados. The validation ensures that the CWL can be parsed and is semantically correct. As of Arvados 2.3.1, workflow validation also detects circular dependencies in the CWL definition. The check for circular dependencies also happens when the workflow is submitted to Arvados.
As an example, we check the CWL command line tool fastqc_blog_broken.cwl which runs fastqc on an input fastq. An typo has been introduced: the type of the input fastq1 was changed to Files, where it was supposed to be File.
The output of the validation indicates that the CWL code has an issue:
$ arvados-cwl-runner --validate fastqc_blog_broken.cwl
...
ERROR Tool definition failed validation:
fastqc_blog_broken_1.cwl:16:1: checking field `inputs`
fastqc_blog_broken_1.cwl:17:3:   checking object `fastqc_blog_broken.cwl#fastq1`
fastqc_blog_broken_1.cwl:18:5:     Field `type` references unknown identifier `Files`, tried
                                   file:///.../arvados-tutorial/blog-examples/debugging/fastqc/fastqc_blog_broken.cwl#Files
The fastqc_blog.cwl tool definition, which does not have the typo, validates properly:
$ arvados-cwl-runner --validate fastqc_blog.cwl
...
INFO Resolved 'fastqc_blog.cwl' to 'file:///.../arvados-tutorial/blog-examples/debugging/fastqc/fastqc_blog.cwl'
fastqc_blog.cwl is valid CWL.
CWL input validation
The workflow validation option to arvados-cwl-runner described in the previous section only validates the CWL. It does not check that the inputs, which are typically provided in a YML file, are of the correct type expected by the CWL workflow.
CWL input validation is done automatically when the workflow is submitted to Arvados.
For example, when a Directory is provided as an input for for fastq1 in fastqc_blog_mismatch.yml where the workflow expects a File, the workflow submission will fail:
$ arvados-cwl-runner fastqc_blog.cwl fastqc_blog_mismatch.yml
...
ERROR Workflow execution failed:
Invalid job input record:
fastqc_blog_mismatch.yml:1:1: the `fastq1` field is not valid because
                                Expected class 'org.w3id.cwl.cwl.File' but this is 'Directory'
ERROR Workflow error, try again with --debug for more information:
Workflow did not return a result.
Using the Arvados log files
If a workflow or tool submits without error to Arvados but does not complete successfully, the first step to find the issue is to look at the log files.
Arvados provides several log files for each container it executes. This section provides an overview of the more commonly used log files.
Unless arvados-cwl-runner is invoked with the --local option, it will start a workflow runner Arvados container that will, in turn, submit all the containers for the workflow to Arvados.
The workflow runner tracks which steps of the CWL workflow need to be run when, which have been run already, what order they need to be run, which can be run concurrently and creates the necessary container requests. The workflow runner logs can be found in the Logs tab of the main workflow in Workbench. Each step has its own logs related to containers running a CWL step of the workflow. In workbench, those logs can be found by expanding the steps and clicking on the link to the log collection.
On the command line, the arv tool can be used to get the uuid of the log collection, which can then be accessed as a set of files via arv-mount. The user guide explains how to access collection contents from the command line. It is also possible to access collections via one of the SDKs.
Below is a snapshot of the log collection of a failed container request:
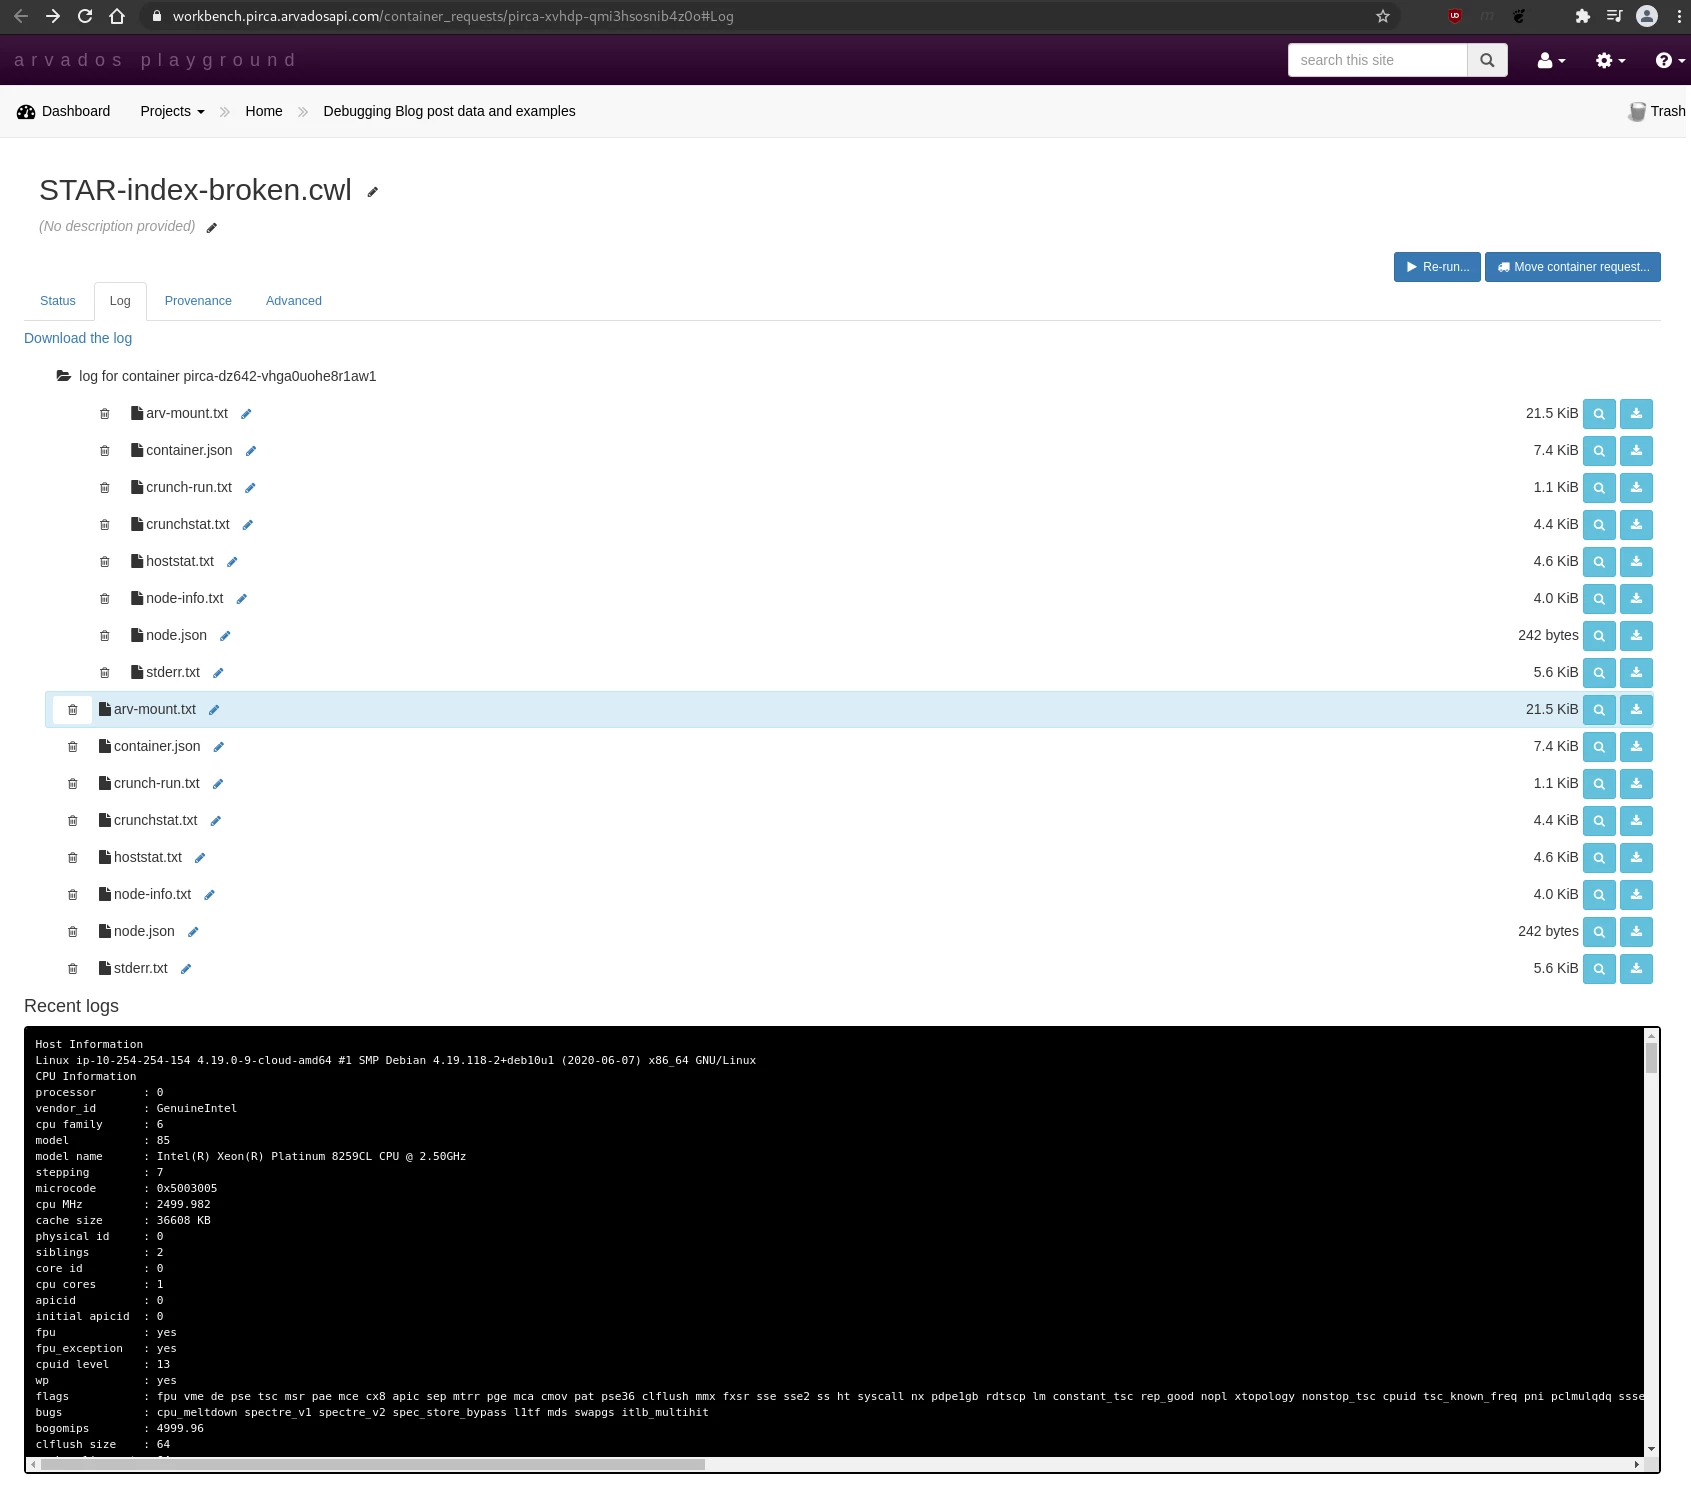
These are the log files generated by Arvados:
-
stderr.txt: This is a great place to start when debugging a failed run (or a run that gives unexpected results). Captures everything written to standard error by the programs run by the executing container.
-
stdout.txt: Captures everything written to standard out by the programs run by the executing container.
-
node-info.txt: Capabilities and specifications of the virtual machine, as reported by Linux tools running on the virtual machine itself.
-
node.json: A high level overview about the instance type, such as name, price, and RAM. This information comes from the Arvados configuration, which is typically copied from the cloud provider’s price list. Some figures, notably RAM size, are typically close but not quite equal to the corresponding figures in node-info.txt.
-
crunch-run.txt: Information about how the container’s execution environment was set up (e.g., time spent loading the docker image) and timing/results of copying output data to Keep (if applicable).
-
crunchstat.txt: Information about resource consumption (RAM, cpu, disk, network) by the container while it was running.
-
hoststat.txt: Details about resource consumption (RAM, cpu, disk, network) on the node while it was running. This is different from crunchstat.txt because it includes resource consumption of Arvados components that run on the node outside the container such as crunch-run and other processes related to the Keep file system.
-
container.json: The json description of the Arvados container object.
Arvados log files: a failure example
As an example, we submit a workflow that fails during execution, and resolve why it failed by using the logs. The CWL files are available here.
arvados-cwl-runner --project-uuid pirca-j7d0g-esxj0i6rwqci132 --no-wait STAR-index-broken.cwl STAR-index.yml
The failed workflow step can be found on the Arvados playground.
The stderr.txt log file indicates that something is wrong with the memory allocation:
2021-06-16T19:48:26.772909733Z !!!!! WARNING: --genomeSAindexNbases 14 is too large for the genome size=249250621, which may cause seg-fault at the mapping step. Re-run genome generation with recommended --genomeSAindexNbases 12
2021-06-16T19:48:29.376258632Z terminate called after throwing an instance of 'std::bad_alloc'
2021-06-16T19:48:29.376258632Z   what():  std::bad_alloc
The crunch-run.txt log file provides additional information about the status of the container execution environment, including the docker container that ran this workflow step.
021-06-16T19:48:15.102948472Z crunch-run 2.2.0 (go1.16.3) started
2021-06-16T19:48:15.102999410Z Executing container 'pirca-dz642-7hc4igolissn5oh'
2021-06-16T19:48:15.103010058Z Executing on host 'ip-10-254-254-84'
2021-06-16T19:48:15.188750604Z Fetching Docker image from collection '2975e1250c18c7a8becb73ddce572480+134'
2021-06-16T19:48:15.206050230Z Using Docker image id 'sha256:8993688148d9178dd5b0076e8924f604074bb4b73b6dab0b163e19db0ada4607'
2021-06-16T19:48:15.206851288Z Loading Docker image from keep
2021-06-16T19:48:16.879249955Z Docker response: {"stream":"Loaded image ID: sha256:8993688148d9178dd5b0076e8924f604074bb4b73b6dab0b163e19db0ada4607\n"}
2021-06-16T19:48:16.879459532Z Running [arv-mount --foreground --allow-other --read-write --crunchstat-interval=10 --file-cache 268435456 --mount-by-pdh by_id /tmp/crunch-run.pirca-dz642-7hc4igolissn5oh.602395099/keep946110334]
2021-06-16T19:48:17.219802403Z Creating Docker container
2021-06-16T19:48:17.324166684Z Attaching container streams
2021-06-16T19:48:17.431854735Z Starting Docker container id 'c33799de8f8333d3387bdbbf317f1be2bfd6afba6d4fd342e11a82ba06a8b62d'
2021-06-16T19:48:17.999107080Z Waiting for container to finish
2021-06-16T19:48:32.260611006Z Container exited with code: 139
2021-06-16T19:48:32.277278946Z copying "/_STARtmp/.keep" (0 bytes)
2021-06-16T19:48:32.277359840Z copying "/core" (510050304 bytes)
2021-06-16T19:48:35.638936137Z copying "/hg19-STAR-index/Log.out" (2993 bytes)
2021-06-16T19:48:35.640508974Z copying "/hg19-STAR-index/chrLength.txt" (10 bytes)
2021-06-16T19:48:35.641215862Z copying "/hg19-STAR-index/chrName.txt" (5 bytes)
2021-06-16T19:48:35.641876382Z copying "/hg19-STAR-index/chrNameLength.txt" (15 bytes)
2021-06-16T19:48:35.642580535Z copying "/hg19-STAR-index/chrStart.txt" (12 bytes)
2021-06-16T19:48:35.643158351Z copying "/hg19-STAR-index/exonGeTrInfo.tab" (1123248 bytes)
2021-06-16T19:48:35.653183835Z copying "/hg19-STAR-index/exonInfo.tab" (573122 bytes)
2021-06-16T19:48:35.657092960Z copying "/hg19-STAR-index/geneInfo.tab" (69585 bytes)
2021-06-16T19:48:35.658543819Z copying "/hg19-STAR-index/sjdbList.fromGTF.out.tab" (632839 bytes)
2021-06-16T19:48:35.663954297Z copying "/hg19-STAR-index/transcriptInfo.tab" (208431 bytes)
2021-06-16T19:48:37.572832098Z Complete
Arvados is configured to use Docker as the runtime engine, and the docker container exited with code 139, which indicates the process was killed by signal 11 (139 - 128 = 11, SIGSEGV). A SIGSEGV is often caused by a code bug such as a null pointer dereference, e.g. after failing to notice that a memory allocation failed.
When using a cloud dispatcher, Arvados uses the cheapest possible node that satisfies the resource requirements to run a specific workflow step. The node type that was used and its specifications (number of cores, RAM, scratch space) is logged in the node.json file. RAM and scratch space are expressed in bytes:
{
    "Name": "t3small",
    "ProviderType": "t3.small",
    "VCPUs": 2,
    "RAM": 2147483648,
    "Scratch": 100000000000,
    "IncludedScratch": 50000000000,
    "AddedScratch": 50000000000,
    "Price": 0.0208,
    "Preemptible": false
}
In this case, a small cloud node type (t3.small) was used, with 2 Gigabytes of RAM.
The CWL tool description in STAR-index-broken.cwl does not list resource requirements. This means that the default value for ramMin is used, which is 256 Mebibytes (2**20). Arvados restricts the container runtime environment to the amount of ram defined by the workflow definition. In this case, with Docker as the container engine, this is implemented via a cgroup that restricts the amount of memory available to the Docker container.
The resource requirements can be changed in the CWL code so that the step is scheduled on a machine with more resources. Note that CWL specifies resource requirements like ramMin in mebibytes:
  ResourceRequirement:
    coresMin: 2
    ramMin: 12000
arvados-cwl-runner --project-uuid pirca-j7d0g-esxj0i6rwqci132 --no-wait STAR-index.cwl STAR-index.yml
With these changes, the step ran successfully.
The node.json log can be used to check that the node used matched the new requirements:
{
    "Name": "m5xlarge",
    "ProviderType": "m5.xlarge",
    "VCPUs": 4,
    "RAM": 17179869184,
    "Scratch": 200000000000,
    "IncludedScratch": 100000000000,
    "AddedScratch": 100000000000,
    "Price": 0.192,
    "Preemptible": false
}
Getting performance and resource usage information
The crunchstat-summary tool can be used to analyze workflow and container performance. crunchstat-summary analyzes the crunchstat lines from the logs of a container or workflow and generates a report in text or html format. Among other information, crunchstat-summary reports the network traffic, memory usage, and CPU usage of tasks.
As an example, we run crunchstat-summary on the job from the previous section to see exactly how much RAM is necessary to run our job.
crunchstat-summary --container pirca-xvhdp-g4au1jnn9tkfktk
The output shows usage for both the workflow runner job as well as for each step in our workflow. In this case, there is only 1 step.
The tail end of the output shows that the CWL requiring too much RAM for this step, and that it can be reduced which may permit the container to be scheduled on a smaller, cheaper instance from the cloud provider.
# Number of tasks: 1
# Max CPU time spent by a single task: 414.22s
# Max CPU usage in a single interval: 169.99%
# Overall CPU usage: 94.14%
# Max memory used by a single task: 6.84GB
# Max network traffic in a single task: 0.27GB
# Max network speed in a single interval: 26.50MB/s
# Keep cache miss rate 0.14%
# Keep cache utilization 100.00%
# Temp disk utilization 2.80%
#!! workflow.json#main max RSS was 6519 MiB -- try reducing runtime_constraints to "ram":7140383129
#!! workflow.json#main max temp disk utilization was 3% of 96189 MiB -- consider reducing "tmpdirMin" and/or "outdirMin"
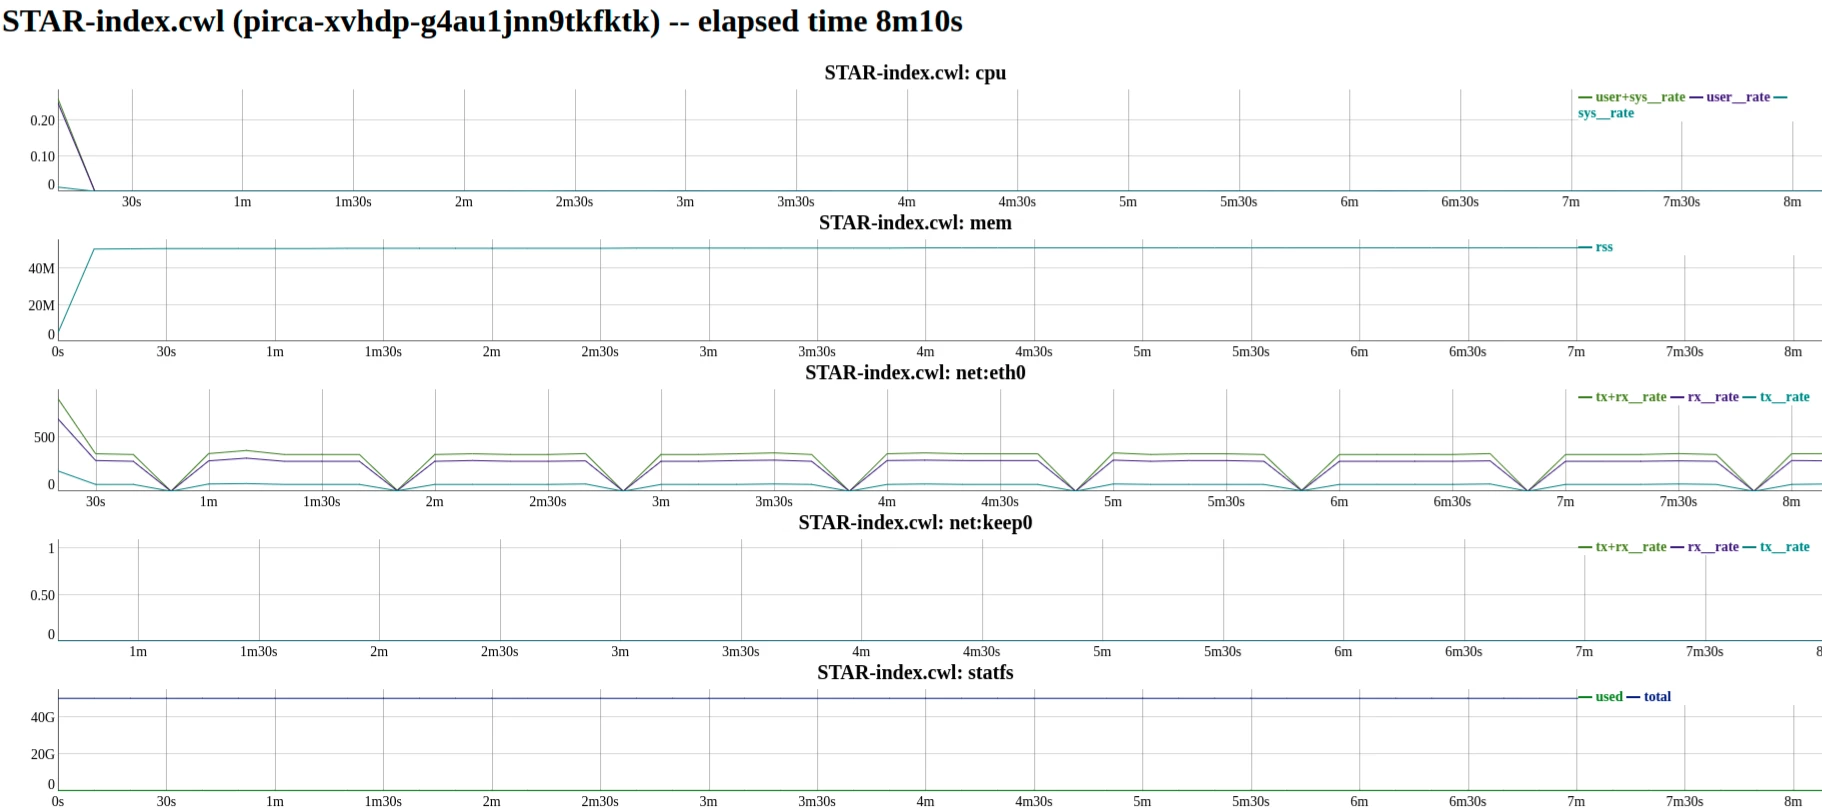
It is also possible to change the crunchstat-summary output format to html by giving it the --format html argument. Doing so will result in plots of memory and keep utilization over the duration of the job.
crunchstat-summary --container pirca-xvhdp-g4au1jnn9tkfktk --format html >/tmp/charts.html
Debugging Locally Using Docker and Mounted Keep Volumes
With arv-mount, Arvados collections can be accessed using traditional filesystem tools. This allows browsing, opening and reading of data in Keep as one would regular files. By mounting a keep volume, a running docker container can access files in Keep as a shared filesystem. This is often useful when you want to debug the code that is being run by CWL.
Because docker runs as a different user, be sure to use the --allow-other cli option when invoking arv-mount so that Docker can access your mounted keep volume.
docker run -ti -v /localkeepdirectory/keep:/keep YOUR_DOCKER_IMAGE
This can be extremely useful because it allows debugging with the data for the workflow without having to download it all first. When working with large amounts of data, copying it all to a local machine may not be possible, let alone practical.
Additionally, this method makes it possible to use the same docker container used on Arvados, which should help to reproduce the same runtime environment as where the error occurred while running on Arvados.
Connecting to a running container for interactive debugging
New in Arvados 2.2.0 is the ability to get access to a running container and interactively debug your workflow.
In order to get shell access to your container while it is running, you will need access to a machine with OpenSSH and arvados-client installed, and the usual Arvados environment variables set
The cluster administrator will also need to enable container shell access. It is disabled in the default configuration because using container shell access can interfere with the reproducibility of workflows. To enable the feature cluster-wide:
- set Containers / ShellAccess / User: true in the cluster config: see the container shell documentation
- up-to-date Nginx configuration: see “new proxy parameters” in the release notes
Once the prerequisites are met, it is possible to run commands and start interactive sessions:
$ arvados-client shell $container_request_uuid top -bn1 | head
...

$ arvados-client shell $container_request_uuid
root@abcdef1234:~# ls /
...
It is also possible to connect to services inside the container, e.g. debugging/profiling/metrics servers, by forwarding TCP ports:
$ arvados-client shell $container_request_uuid -N -L6000:localhost:6000